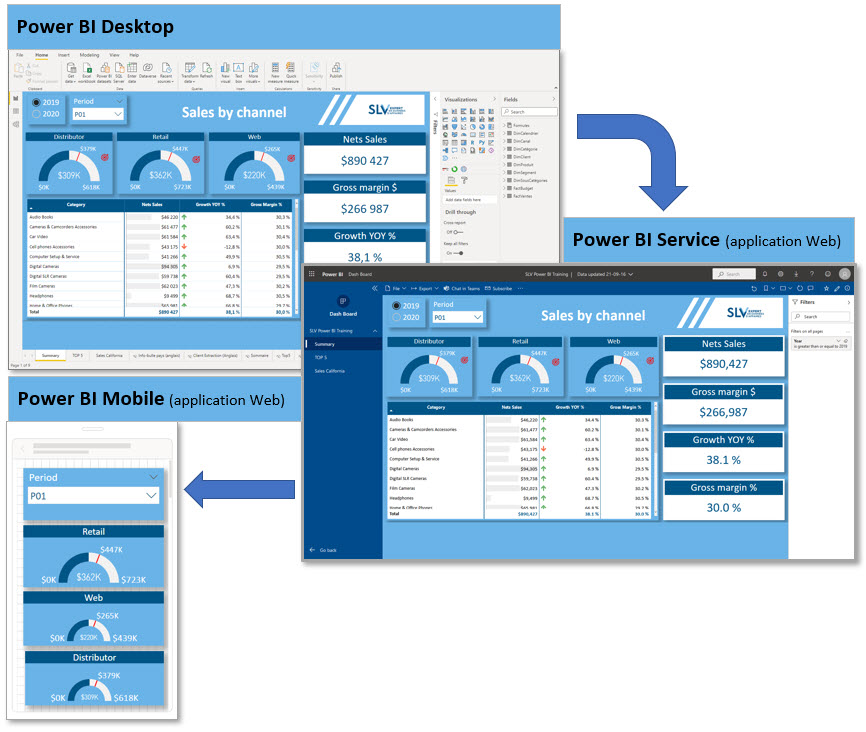
A BI dashboard is a powerful presentation and decision-making tool. Visualizing your performance allows for in-depth analysis and quick action.
Take control of your business data and carry out your company’s strategic plans.

Power BI dynamic dashboard example
Click on the different elements to see the results
Accompaniement
Creation
The expert can intervene at all stages, data loading, transformations, creation of calculation measures, visual designs, security and publication.
Training
Proof of concept
The team of developers and technical support know all the inner workings of Microsoft Power BI.
A team of experienced experts who have mastery of technology, business management and who knows how to make your business data speak.
Time bank
The purchase of an hourly bank gives access to a range of services offered by the technical support team.


